


Assets have addresses
An asset register tells you what you own. A map tells you where it is, who operates it, and what breaks when it moves.

Ask an asset register what you own and it will answer precisely. Ask it where a
specific unit is, who operates it, which contract covers it, or what stops working
if the site changes hands, and you will usually get a cost centre and a shrug.
This is not a data-quality problem. It is a shape problem. A register is a list of
things you have bought. Distribution is a question about places and relationships,
and a list cannot hold either.
it just isn’t there.
The questions people actually ask
In practice the questions that arrive are almost never “how many do we own?”. They
are: how many are live in this city, and how many are still in commissioning? Which
partner installed the ones on that corridor? If this agency changes its policy, how
many sites are exposed? Are we under-covered anywhere our competitors are not?
Every one of those is relational or geographic, and often both. Answering them from
a register means someone joins three exports by hand and produces a number with a
shelf life of about a week.
Put the asset where it physically is
The alternative is to model the asset at the level it exists: a unit, at an address,
belonging to a location, belonging to an entity, with a status of its own. Then a
count is never entered — it is derived from the things being counted, which means
the field number and the head-office number cannot drift apart.
Zoom out and you get coverage. Zoom in and you get the specific pole a unit is
mounted on. It is the same model at both ends.
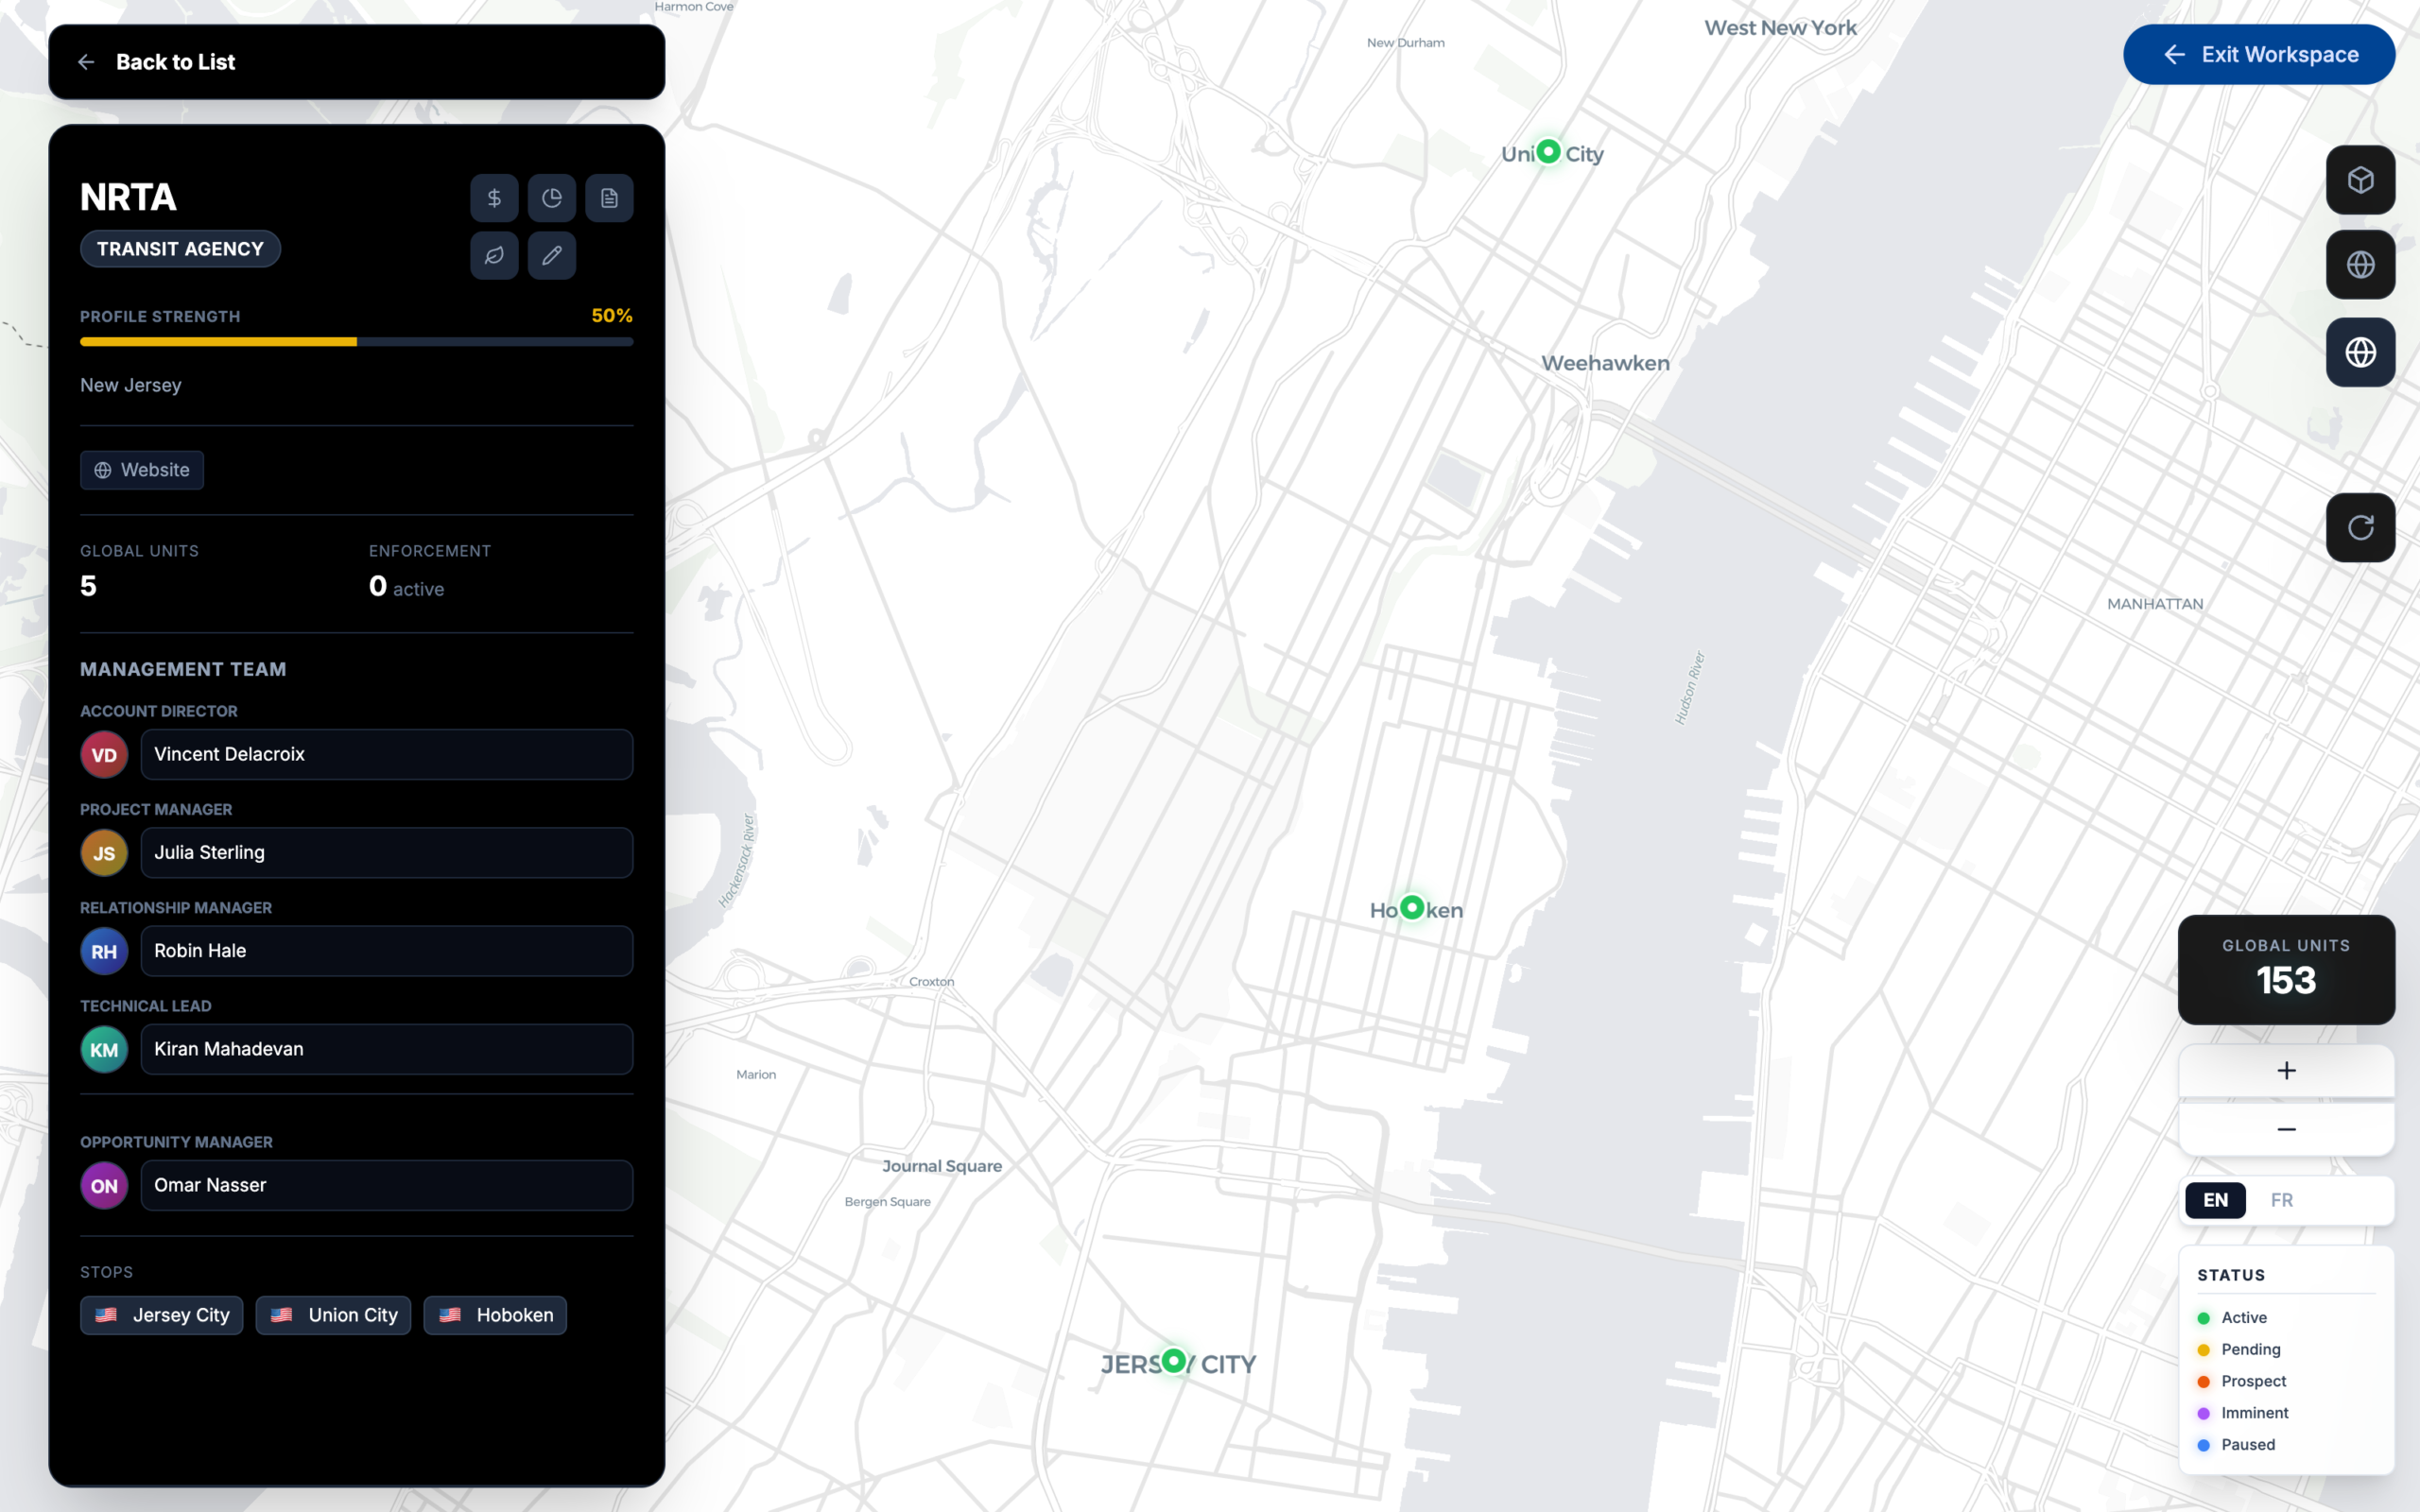
Illustrative data.
Software is an asset with a location too
It is tempting to treat licences as purely financial — a line item, a renewal date,
a seat count. But a licence is almost always doing work somewhere specific: attached
to a deployment, a site, a partner’s operating team, a jurisdiction with its own
rules about where data may live.
When licences sit only in a finance system, two things follow. Renewals get decided
without knowing what they support. And nobody can answer what happens to the
software when the hardware moves — which is the question that shows up during an
incident, at the worst possible moment.
Distribution and economics on one object
The last piece is keeping the commercial model attached to the same sites. If yield
is modelled in one place and deployment tracked in another, the two will diverge,
and the divergence will be discovered during a reconciliation nobody enjoys.
Modelled against the same objects, a change in coverage is immediately a change in
the projection. Not because anyone rebuilt a spreadsheet, but because there was only
ever one set of facts underneath.
The test
A good way to judge an asset model: ask it a question nobody prepared for. Which
sites in this territory are deployed but have no named operating partner? If the
answer takes a week, the model is a list. If it takes a filter, it is a map.